
This is based on work done from 2013 to 2014 presented but not published before.
Summary
Quantifying comments made in an interview or after-action review on how important and ubiquitous a concept is perceived is still more of an art than a science. However, the Effective Comment Number (ECN) provides a metric to rank the concepts encapsulated within the various comments recorded during the after-action discussions and interviews. This metric does not specify how valid the comments are, but instead how important the underlying concept is perceived to be by the participants and how widely that concept is held.
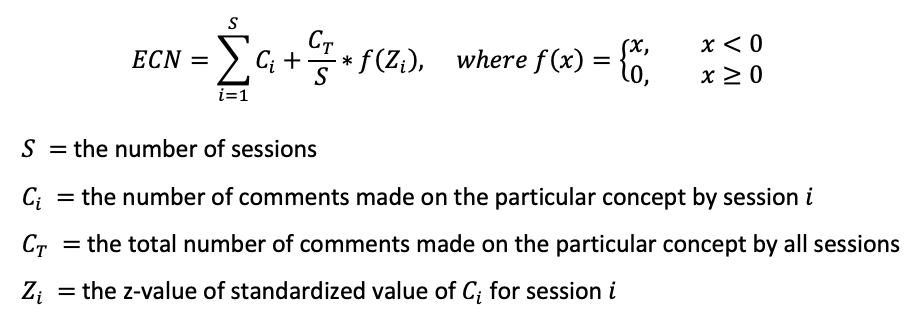
Effective Comment Number (ECN) Equation
The context of how the ECN was invented
Scenario Based Studies
When studying a complex problem within a complex system the following is a typical setup:
- Participants are placed in representational situations and executed against a scripted set of events with data recording
- After scenarios are completed participants are given structure surveys (e.g., perceived workload)
- At the end of all situations the participants perform an after-action report or interview style session
- Other sessions are executed with different participants
Typical After-Action Report Structure
- Made up of group of one or more participants
- Groups do not talk with other groups – each group is an isolated, independent representation of the user population
- Fixed set of starting questions that do not lead the participants
- For example a good question would be: “What issues did you experience, if any, with the (subsystem) during today’s scenarios?”
- A bad question would be: “What issues did you have with the (specific system element) today?”
Example Results
For illustration purposes, these are sample raw recorded comments of three after-action reports:
- Day One:
- Would like a cup holder
- Graphical user interfaces (GUIs) are poorly layout
- The chair was comfortable
- Mouse was hard to use
- Day Two:
- Would like the GUIs to be blue-scaled
- Mouse requires two hands
- The mouse was really slow to use
- Would prefer the background to be blue
- Too much information is in the wrong places
- Would like more blue colors
- Day Three:
- System reminds me of an old database GUI
- Would like a second monitor
- Chair was adjustable
Typical Example Presentation
At this point in the process, it is quite common for researchers to list all the comments in a list to present to the stakeholders:
- Would like a cup holder
- Graphical user interfaces (GUIs) are poorly layout
- The Chair was comfortable
- Mouse was hard to use
- Would like the GUIs to be blue-scaled
- Mouse requires two hands
- The mouse was really slow to use
- Would prefer the background to be blue
- Too much information is in the wrong places
- Would like more blue colors
- System reminds me of an old database GUI
- Would like a second monitor
- Chair was adjustable
Slightly Better Example Presentation
A slightly better representation would be to group the comments:
- GUIs
- Graphical user interfaces (GUIs) are poorly layout
- Too much information is in the wrong places
- System reminds me of an old database GUI
- Mouse
- Mouse was hard to use
- Mouse requires two hands
- The mouse was really slow to use
- Colors
- Would like the GUIs to be blue-scaled
- Would prefer the background to be blue
- Would like more blue colors
- Physical
- Would like a cup holder
- The Chair was comfortable
- Would like a second monitor
- Chair was adjustable
Problems with these types of Presentations
- A group can dominate the outcome
- e.g., Colors was mentioned three times but only by one group
- Grouping hides whether the comments happened across all groups or just one “squeaky wheel” group
- Need a way to consolidate comments and re-weight them for perceived importance across the groups
These problems are why the Effective Comment Number was created.
Effective Comment Number
The ECN score is constructed to take into account how often a concept is discussed in one session and across all sessions and how many participants discussed that concept.
The z-value was computed in excel using functions STANDARDIZE, AVERAGE, and STDEV. The excel worksheet is provided below.
A feature of the ECN score, as defined above, is that this number can never be greater than the total number of recorded comments or less than zero. Thus, if the total number of comments relating to a concept is 12, the ECN score can only be equal to or lower than 12, but not greater. Therefore, if the comments are not evenly distributed across the sessions, the ECN score will be lower than the total number of comments represented based upon the fact that this concept is not ubiquitous. For example, concept A, with an ECN of 12, is twice as important and more widely held than concept B, with an ECN of 6.
ECN Approach
- Group comments by underlying concept
- Compute ECN for each concept group
- Reorder concepts and present
Group Comments by Underlying Concept
The first step is to take each discretely recorded comment and group it according to the underlying concept. For example, one participant may have stated, “I think the button should be a different color, maybe blue.” Then, another participate may have stated, “I dislike the current button color, try something different.” These two comments would be grouped together as relating to the concept that the button color is disliked. One could argue that the decisions on “grouping” are still an art form, and he or she would be correct. However, if a consistent approach is taken to determine how comments are grouped together, the ECN score still provides a valid and consistent way to compare the groups and the concept’s importance and ubiquitousness.
This involves two steps
- Group comments based on relating to the same underlying concept
- Construct a representational group comment
For example based on the dataset provided above the following would be a good grouping with the session number in parenthesis:
- The GUIs presenting information in wrong places
- (1) GUIs are poorly layout
- (2) Too much information is in the wrong places
- (3) System reminds me of an old database GUI
- The mouse was hard to use
- (1) Mouse was hard to use
- (2) Mouse requires two hands
- (2) The mouse was really slow to use
- The colors scheme would be better in blues
- (2) Would like the GUIs to be blue-scaled
- (2) Would prefer the background to be blue
- (2) Would like more blue colors
- The Chair was comfortable
- (1) The Chair was comfortable
- (3) Chair was adjustable
- (1) Would like a cup holder
- (3) Would like a second monitor
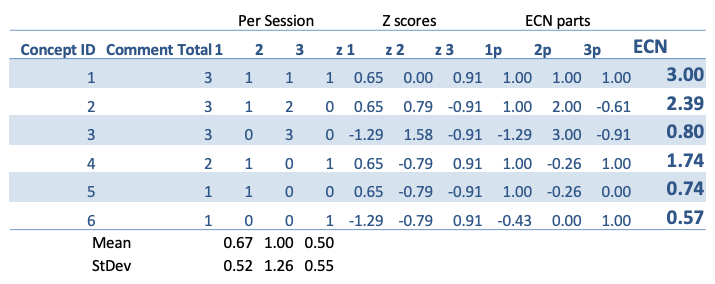
ECN Math
Using the ECN equation from above the following ECN scores were computed using excel:
Presentation based on ECN scores
Using the ECN scores to order the group comments provides the following presentation:

This provides an actionable list to stakeholders and is clearer than either of the two typical presentations above. Plus it answers the question, “How widely perceived was this comment?”
